As part of the EU Horizon 2020 funded project, StepUP, project coordinator IES has created a large scale district model encompassing 114 buildings within the Municipality of the 18th District of Budapest, providing a powerful decision-making tool to evaluate and inform an energy renovation roadmap for the area’s buildings.
The aim of this study was to facilitate a portfolio analysis of the Budapest 18 (BP18) Municipality that would allow the portfolio managers to make decisions about where to invest next in the renovation of their existing buildings. A district level model was created to achieve the following objectives:
- Identify the worst performers: to investigate which buildings would have the biggest impact when renovations are carried out
- Test renovation scenarios: to check which energy conservation measures (ECMs) will perform better
- Track progress over time: to track which buildings are being renovated and verify energy savings
The IES iCD masterplanning tool was used to create this model, and the IES iCIM tool was used to visualise this model in a browser.
The Municipality of BP18 had developed an existing Energy Renovation Action Plan Roadmap for a selection of its buildings, which outlined a number of proposed renovation measures over a 10-year period. This roadmap was studied to understand the work that has already been carried out in the district and the plans for future renovation projects. The municipality collected a lot of data from the buildings in the district and filtered out the renovation measures that were advisable, which included interventions such as insulation upgrades, the replacement/modernisation of windows and doors, HVAC system upgrades and solar PV installations.
Data that had previously been collected from a survey of 114 municipality buildings was fed into the iCD tool to create a model that would be more visual and interactive for the decision makers and other key stakeholders during the renovation process. The type of data collected related to the geometry and construction of the buildings, HVAC systems, occupancy profiles, infiltration and energy data.
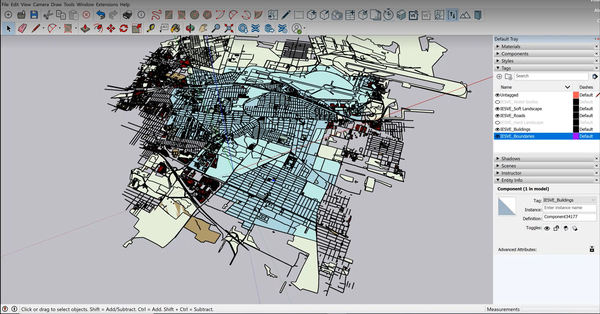
Figure 1. Budapest 18 district modelled in iCD (shaded in blue)
The floorplans, basic geometries and floor information was imported into iCD using OpenStreetMap (OSM) (see in Figure 1 – the OSM imported model of the district), which provides a quick route to creating a large scale district model such as this where there are multiple buildings under consideration. As the availability of information from OSM varies from city to city, some of the 114 buildings in question were missing from the OSM import and had to be drawn separately within the iCD tool, before all buildings were populated with the data from the survey as part of a validation exercise. Figure 2 shows the data input where information was available from the municipality’s survey.
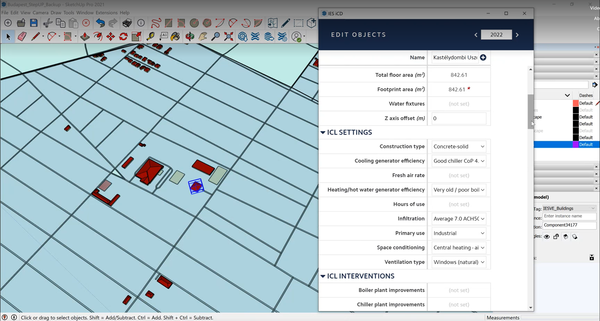
Figure 2. Data input in the iCD model
The buildings’ energy performance was simulated in iCD based on the available data, with the results from the simulation validated using the metered energy data provided in the survey. This exercise is carried out to confirm that the buildings in the digital model accurately reflect how the real buildings are performing, to provide a reliable baseline for future roadmapping and testing of proposed renovation measures. Once the baseline model with the available building data is set up and validated with the real energy data, this can be synced with the iCIM tool and made publicly available on a browser for visualisation (Figure 3).
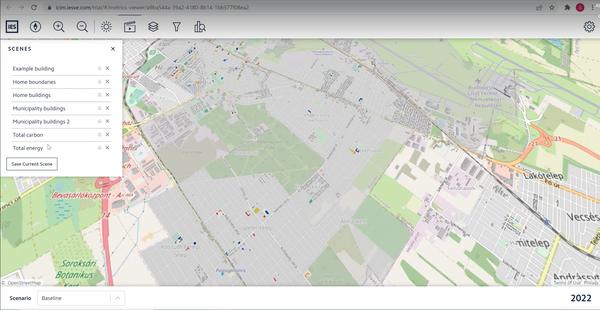
Figure 3. 114 buildings modelled in the iCD and available for visualisation in the iCIM platform
Within the tool there is a metrics viewer, which allows the user to visualise which buildings have a greater scope for positive impact from renovation. This employs a colour coding system, in which the buildings requiring closest attention are highlighted in deep red, while those at the lower end of the scale (e.g. in terms of their carbon emissions, energy consumption, etc.) are highlighted in pale yellow. For example, in Figure 4, the deeper the red, the higher the carbon emissions of the buildings. If that is the intended KPI for renovation, the decision makers can therefore quickly and easily identify which buildings should be targeted for renovation first.
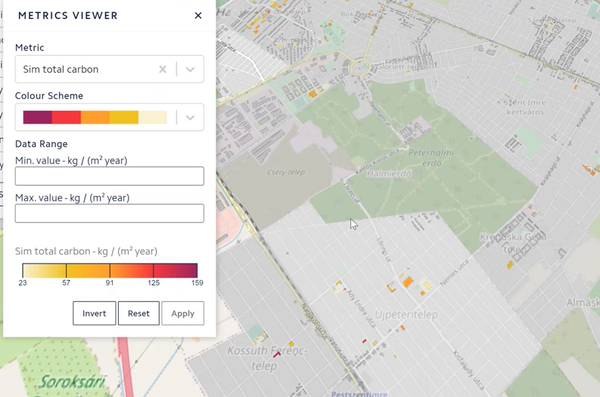
Figure 4. Metrics Viewer in the Portfolio Overview (iCIM) tool
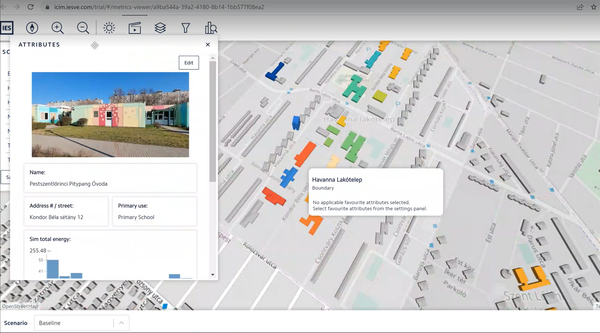
If the user wants to delve deeper into the performance of a specific building, they can select individual buildings within the model to visualise that particular building’s data and simulated performance, as seen in Figure 5 and Figure 6 below.
Figure 5. Example kindergarten building in the iCIM tool – basic information
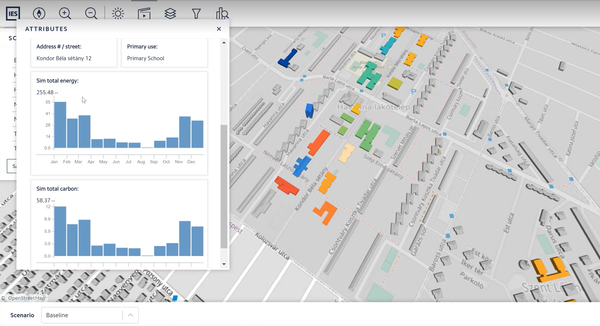
Figure 6. Example kindergarten building in the iCIM tool – monthly simulated results (total energy and carbon)
The feedback collected from this test site, and also a second Spanish pilot site participating in the StepUP project, confirmed the value of the tool for municipalities and other public/statutory bodies. This can encompass a range of different stakeholders, including those trained to use the iCD tool to model and test the renovation measures themselves, or another stakeholder within these organisations with less training (e.g. by using iCIM on the browser to simply visualise and engage with the results). In addition, the tools can be useful for renovation strategy advisors within ESCOs, consultants or design teams that advise on local renovation plans.
The use of the tool was validated by the municipality who suggested that the tool can give a good roadmap of the renovation process for their buildings, provided that the data used in the model is collected actively by the municipality.
Within the scope of the StepUP project, which set out with the aim of making the renovation of existing buildings a more reliable, attractive and affordable investment, these tools play a vital role in the feasibility phase of renovation projects, as they can give first level input on potential energy savings on different buildings and prioritisation. The project has in turn enabled IES to advance further improvement of features within its iCD and iCIM tools.
Additionally, connectivity with IES’ online data management platform, iSCAN, was developed. This meant that during the later stages of deep renovation, results from a more detailed analysis could be connected on the same platform and presented, as well as compared, with any live or historical data connections available on the iSCAN platform (See Figure 7).
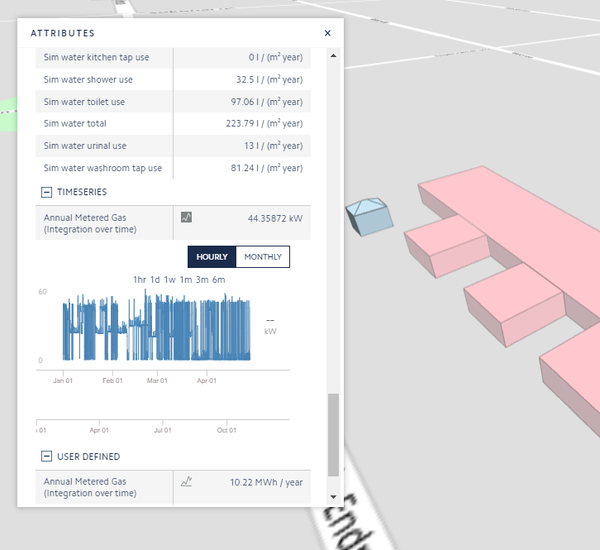
Figure 7. Timeseries on the iCIM tool from the Data Management Platform
The process and tools deployed in the project can therefore support throughout the renovation process, from initial feasibility studies right through into the operation phase, to monitor and verify the impact of any investments once implemented. User roles were also defined in the iCIM platform, and a permissions function was introduced, limiting the accessibilities based on a user’s role in the project. These users are split into: Owner, Editor, Modeller, Viewer and Contributor, enabling the different stakeholders of the deep renovation process to interact individually with the platform.
 This project has received funding from the European Union’s Horizon 2020 research and innovation programme under grant agreement no. 847053.
This website reflects only the author’s views. The European Climate, Infrastructure and Environment Executive Agency is not responsible for any use that may be made of the information it contains.